qEEG Documentation — March 2015

The Brain Mapping
Record

In March 2015, Kurtis Todd sat in a clinic in Sarasota while a neurologist mapped his brain in three states — resting baseline, and two deliberately induced meditative states. What the instruments recorded fell categorically outside the parameters of ordinary clinical experience.

Three states. Two results that had no precedent. A quantitative electroencephalogram — measuring amplitude, frequency, and inter-regional synchronization — was the instrument.

← Brain Mapping overview

The normal adult brain produces electrical activity ranging from approximately 10 to 100 microvolts on the scalp, with most waking states operating between 10 and 50 μV. Alpha waves — the signature of calm, alert wakefulness — typically run below 50 μV in posterior regions. These figures are well established across decades of clinical electroencephalography.

The session documented here recorded three distinct brain states. The baseline reading placed the author's brain squarely within normal parameters. What followed did not.

Amplitude Readings — Three States

Meditation Baseline

70
μV

Within the established normal range. Consistent with a calm, resting adult brain.

Meditative State A

200+
μV

Already beyond the upper boundary of what standard scales account for.

Meditative State B

700+
μV

Seven times the upper boundary of normal human experience. Categorically outside the scale.

What These Measurements Mean

Cross-Frequency Coupling

Neuroscience has established that one of the brain's most significant organizational features is cross-frequency coupling — the way slower oscillations coordinate and modulate faster ones. Theta rhythms (4–8 Hz) organize gamma activity (30–80 Hz) in regions associated with working memory, attention, and conscious awareness. Researchers have proposed that this hierarchical coordination may be a prerequisite for consciousness itself — breaking down under anesthesia and in cognitive decline, and intensifying in states of heightened integration.

What this session’s data appears to show is theta organizing higher-frequency activity in exactly this fashion — the signature reported in advanced practitioners (Lutz et al., 2004). But it was annotated from a z-score chart whose display topped out at 30 Hz, the edge of standard clinical convention. Whether genuine gamma above 30 Hz was present cannot be established from that chart; it would take the raw data and confirmation from the neurologist who ran the session. We present the coupling as apparent, not proven.

Buzsáki & Watson (2012); Axmacher et al. (2010); Voytek et al. — published in PMC / Frontiers in Neuroscience

Amplitude and Its Clinical Significance

Set against the ordinary clinical span already described, 700+ µV has no waking precedent. The one place the record routinely shows readings in the hundreds is the wrong comparison — epileptiform and seizure activity. But seizures are involuntary and pathological, with an unmistakable signature: impaired or lost consciousness, motor convulsion, and a depleted, disoriented recovery afterward. State B carried none of it. It was entered on purpose, the subject stayed conscious and aware throughout, and it was repeatable within the session.

LearningEEG.com; StatPearls / NCBI; Medscape EEG Waveforms Reference

Deliberate Induction — Not Artifact

High EEG readings have ordinary explanations before they have extraordinary ones, and a careful technician rules them out first. Muscle tension (EMG) throws high-frequency, broadband noise across the scalp from a clenched jaw, scalp, or neck. Eye movements and blinks (EOG) produce large, slow deflections at the front of the head. Movement, loose electrodes, sweat, heartbeat, and 60 Hz line current each leave a recognizable fingerprint — and a qEEG technician identifies and removes them as a matter of routine.

The skeptic’s first reach is muscle — the right instinct, which is exactly why it matters that it does not fit. EMG is a high-frequency artifact; State B was dominated by a clean theta rhythm — identified as theta by the neurologist who recorded the session. A theta-dominant signal is the opposite of what clenched muscle produces. (The 200+ µV concentrated state, entered with effort, is the one where muscle activity legitimately contributes — which is why it reads differently from State B.) What remained after the ordinary explanations were exhausted was deliberate, repeatable, scalp-wide, theta-dominant, and physiologically costly: a structured phenomenon, not an artifact.

qEEG session · Sarasota, Florida · March 2015

Clinical Observations

What the documentation
recorded and preserved

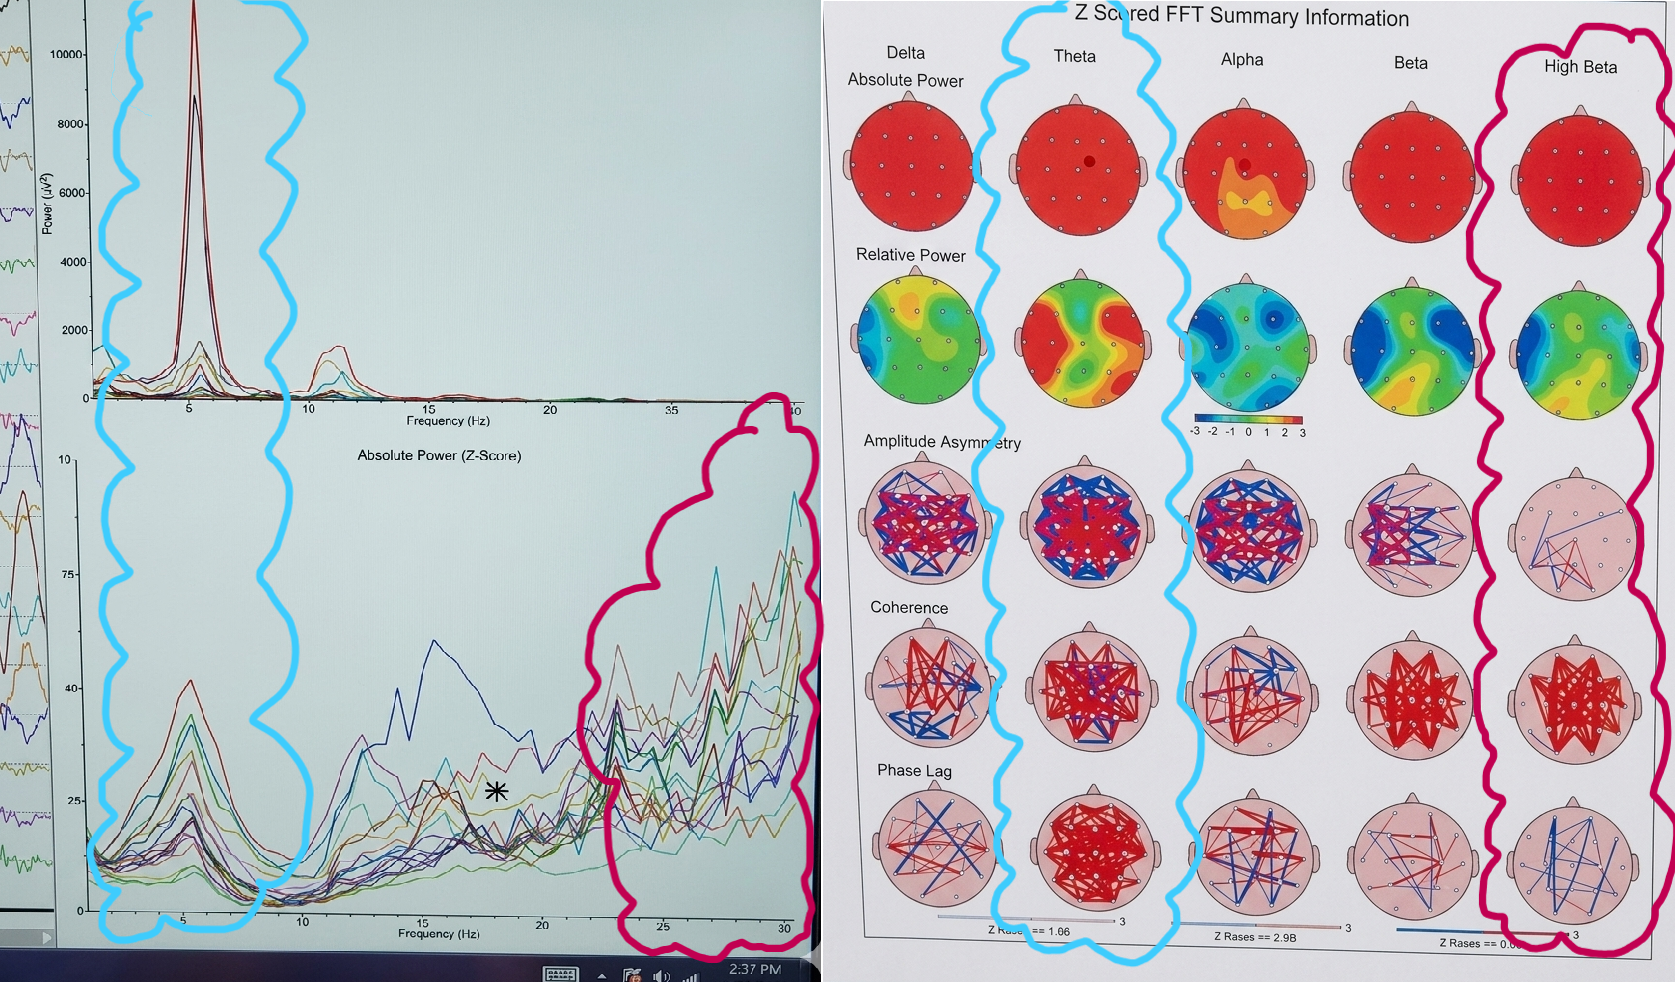
Beyond the amplitude readings, the session documented anomalies in other metrics — patterns in inter-regional communication that fell outside the parameters of ordinary clinical experience.

Annotated State B Reading

Annotated qEEG State B power frequency distribution

Blue

Theta

Red

High beta

Panel guide

Top-left: absolute power (uV) by frequency · Bottom-left: z-scores by frequency · Right panels: topographic head maps · Red on maps = highest readings, blue = lowest

Top-left graph — blue annotation

The Theta Spike

That spike annotated in blue is the dominant theta peak. Horizontal axis: frequency in Hz. Vertical axis: total power in microvolts. Normal waking brain states peak below 50 uV. Sleep's highest synchronized delta reaches roughly 75 uV. This was recorded in a deliberately induced, fully waking state — far outside the normal range.

Bottom-left graph — red annotation

High Beta Z-Scores — Beyond the Display Ceiling

The bottom-left graph shows z-scores — deviation from population norms, not raw power. The red-annotated high-beta peaks are the highest on the chart, appearing to reach and potentially exceed the display ceiling at 30 Hz. The chart stops there because that is where standard clinical qEEG display conventions end — not because the activity stops.

High beta having the highest z-score does not mean it is louder than theta. It means high beta is more anomalous relative to population norms for that frequency. Theta still dominates in raw amplitude by a large margin. Both readings are anomalous. They are measuring different things.

Right panels — blue annotation on head maps

Theta Dominates Every Measured Parameter

The head maps show theta (blue annotation) as red — saturated — across every measured parameter: relative power, coherence, phase lag, and others. Values appear to reach or exceed the display ceiling in multiple parameters. The precise z-score figures require confirmation from the neurologist's raw data. What the maps show visually is unambiguous: theta is the organizational frequency of the entire brain state, expressed in every dimension the instrument measured.

Right panels — red annotation on head maps

High Beta — Anomalous in Z-Score, Quieter on Maps

The head maps show comparatively less spatial activity in high beta than theta — but the z-score values are numerically the highest of any frequency band. This is the cross-frequency coupling signature: theta is the dominant carrier wave, large in amplitude and widespread in cortical expression. High beta is the coupled passenger, anomalously elevated in relative terms, carried farther by the theta than it would propagate independently. The slow wave organizing the fast one.

The relationship between the two annotations is the finding: a high-amplitude theta state carrying simultaneously elevated high-beta activity. Theta dominant in raw amplitude and spatial expression. High beta anomalous in z-score. The organism synchronized across frequency ranges simultaneously. What the research calls the neural correlate of integrated conscious states.

The framework has a name for this pattern, and an account of why a brain would synchronize at an amplitude its own metabolism cannot supply — and that account is the spine of the book, not a web page. The data does not prove the interpretation. It is consistent with it in a way no available alternative adequately accounts for. Measurable. Measured here.

All readings: March 2015 · Sarasota, Florida · Annotated by Kurtis Todd

The Question the Data Raises

What Was Powering This?

The brain does not generate its own energy. It converts metabolic resources — glucose, oxygen, blood flow — into electrical activity. Neural firing is metabolically expensive. The brain at rest already consumes approximately 20% of the body's total energy output despite representing only 2% of its mass. Every additional increment of amplitude and synchronization carries a corresponding metabolic cost.

A 10× increase in amplitude does not simply happen because a person decides it should. The body has a finite metabolic capacity. The individual organism, operating within its ordinary resources, does not have a lever marked "produce ten times more synchronized electrical activity." The finite endurance of the state — documented in the session — is itself evidence of real metabolic demand. The structure could sustain it for a limited duration, then could not.

This raises a straightforward question: if the individual's ordinary metabolic resources are insufficient to account for the amplitude recorded, what is the additional source?

The framework's answer begins where the individual's resources end — not with a force breaking in from outside, but with what a structure becomes able to receive once it has been built, over years, into the right kind of form. What that means, and why the structure permits it, is the argument the book makes from the ground up. The page stops at the question on purpose.

This interpretation is the framework's account of the data. It is not the only possible account. What is not in dispute: the amplitude was real, the metabolic cost was real, the individual's ordinary resources are insufficient to explain it, and the state was finite. The framework provides the most coherent explanation for the pattern. Materialism has not.

How It Was Built

Not Magic.
About Three Years of Structural Reorganization.

This did not happen suddenly. It was not a gift or an accident or a single moment of breakthrough. The session recorded in March 2015 documented the result of approximately three years of deliberate, structured, daily practice — applied not just consciously but subconsciously, running through the whole system, reorganizing it from the inside.

The process works like training a muscle. The muscle does not grow because you understand how it grows. It grows because you apply the correct load, consistently, over sufficient time, and the body reorganizes at the structural level in response. The reorganization is physical. It is incremental. And it happens below the level of conscious intention — the subconscious and the body changing their organization because the conditions for that change have been created and held.

The same principle applies here. The conscious mind understood the framework — but understanding is not structural change. The subconscious and the body had to reorganize to match what was understood, and that happened slowly, through years of practice, each increment making the next one possible.

The Horizontal Dependency

The conscious and subconscious minds are horizontally dependent — neither side can change unilaterally. You cannot consciously will a subconscious reorganization any more than you can consciously will a new muscle fiber. What you can do is create the conditions, consistently and in the right sequence, under which the reorganization occurs on its own at the structural level. This is why the practice must be embodied, repeated, and sustained — not merely understood.

The Vertical Cascade

As that inner structure comes into coherence — brain and body, conscious and subconscious — something becomes available to it that was not before. The creature does not reach up and take it. It clears the obstruction, and a more ordered form lets more through. What that source is, and how the clearing works, is the heart of the book.

The 70 μV baseline is not the starting point of the practice. It is the starting point of the session. The 700+ μV is not a miracle. It is the end of about three years of practice. The gap between them is not mystery — it is the cumulative result of structural reorganization applied over time, incrementally, consistently, and in the right sequence. What the session measured was not an exception to the framework. It was the framework — operating exactly as described, made visible by the instruments.

A Note

If this doesn't fully make sense to you — that is completely normal.

No need to fret. What is gestured at here is the conclusion of a nine-chapter argument built from the ground up — not meant to be grasped from a single page, or in isolation.

The book and the Application Manual are a deliberate and systematic approach to understanding and implementing this structure — designed so that each piece arrives in the order that makes the next one possible.

To allow the infinite comprehension to slowly localize.

Start at the Beginning → How the System Works →

"I drove home that evening no longer wondering. The instruments had seen what I had felt. What I had been experiencing was not a narrative I was constructing to comfort myself. It was not mysticism. It was not self-delusion. It was measurable, physical, and real — documented in the most literal and empirical and gloriously undeniable sense of those words."

"The question I turned over the entire drive home was the only one that had ever really mattered: what is actually happening here, and why?"

— from the Preface, Infinitely Simple

← Back to the Brain Mapping overview